Lock-in Amplifier or Boxcar Averager? Comparing Two Measurement Approaches for Periodic Signal Analysis
From: Zurich Instruments
Posted On: 28 Aug 2024
In this post, we’ll explore two powerful techniques for the analysis of periodic signals: lock-in amplifier and boxcar averaging. These methods are pivotal in obtaining high measurement precision, preserving information content, and reducing measurement times when it comes to measuring small periodic signals buried in noise. A similar comparison can also be seen in this webinar.
As scientific experiments become more complex, the effects being investigated become increasingly smaller, producing ever-fainter signals. In optics and photonics research, it’s nowadays a very common requirement to be able to measure relative effects or variations down to a ratio of 1:10-7or even smaller (e.g. as in pump-probe or Raman spectroscopy), making signal recovery and signal-to-noise ratio (SNR) optimization a challenging task. It’s therefore hard to overstate the importance of choosing the best possible measurement approach, as it can make the difference between a successful and unsuccessful measurement.
Understanding Noise in Experiments
Before analyzing any signal, it is vital to characterize the noise in the experiment. Noise sources can be observed in frequency spectra (see an example in Figure 1) which typically include:
- 1/f Noise (sometimes known as pink poise): Increasing as the inverse of frequency as we approach DC
- white noise: A flat frequency spectrum
- noise spikes: coherent pickups, such as 50/60 Hz power line noise
In photonics experiments, laser relative intensity noise (e.g. due to thermal fluctuation of the gain medium, excess noise of the pump source, or vibration of resonator mirrors) often contributes to 1/f noise, while detector shot noise contributes to white noise.

The most common approach to reducing noise is averaging. Averaging is equivalent to low-pass filtering around DC, where the noise contribution is highest (blue shaded area in Figure 1). To shift the signal in a less noisy frequency band, a modulation is introduced. In optics, signal modulation is generally accomplished by modulating the excitation laser light using choppers, acousto-optic modulators (AOM), or electro-optic modulators (EOM). After modulating the signal, demodulation at the same frequency is necessary, using for example lock-in amplifiers and boxcar averagers.
Lock-In Amplifiers measurement principle
Lock-in amplifiers take the signal of interest, often buried in noise, and multiply it with a reference signal at a certain frequency fmod. This multiplication effectively shifts the signal around the modulation frequency fmod. The result is then sent through a series of cascaded low-pass filters, which filter out unwanted spurious components. This procedure, depicted in Figure 2, allows us to recover both the amplitude and phase of our signal with respect to the reference signal. The overall transfer function of a lock-in amplifier can be thought of as the one of a band-pass filter with tunable center frequency and bandwidth.
In Zurich Instruments lock-in amplifiers, all the demodulation steps including the signal-reference mixing and low-pass filtering are performed in the digital domain, rather than physical RC (resistance-capacitance) filters. This digital approach allows for flexible and customizable filtering to determine the best trade-off between noise rejection and measurement speed according to the experimental needs.
Additionally, the use of digital signal processing techniques allows:
- time and frequency domain analysis with multiple tools simultaneously: integrated tools like scope, sweeper, and multiple demodulators
- broad frequency range coverage: from DC up to 8.5 GHz

Boxcar Averagers Measurement Principle
For signals with low-duty cycle, i.e. signals where the relevant information is contained only in a fraction of the period, the signal power is distributed across multiple harmonics in the frequency domain, with a frequency span inversely proportional to the duty cycle.
Therefore, to be able to capture the information within these harmonics, we need a measurement technique whose detection bandwidth expands to more than a single harmonic (as for the lock-in amplifier), ideally comprising the whole bandwidth of the signal of interest, as shown in Figure 3.

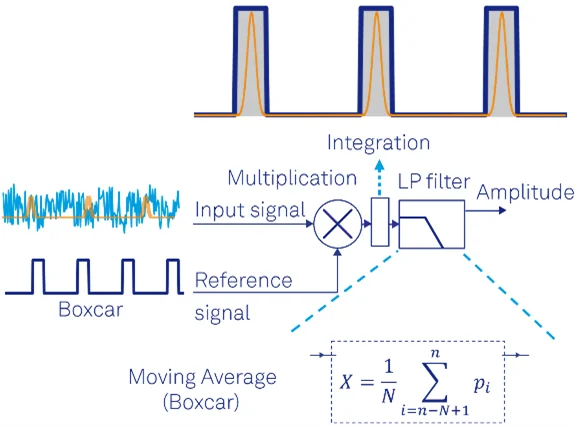
The measurement operation of a boxcar averager is relatively simple: multiply the signal of interest with a square wave of an arbitrary duty cycle, integrate when the pulse is high, and filter using a moving average filter, as outlined in Figure 4.
Additionally, thanks to a fully digital implementation of a boxcar averager, the user can further benefit from:
- multiple boxcar units: two independent boxcar units with baseline subtraction option (e.g. to calculate the normalized pump-probe signal directly, as explained in this blog post)
- periodic waveform analyzer (PWA): facilitates the process of choosing the width and the position of the boxcar window, also in cases where the input signal is buried in noise
Comparing Lock-In Amplifiers and Boxcar Averagers
Deciding whether to use a lock-in amplifier or a boxcar averager ultimately depends on the properties of the signal of interest and the property of the noise background. Let’s start with two extreme cases, where the choice is clear:
- purely sinusoidal signals: best analyzed with lock-in amplifiers.
- application examples: Tunable Diode Absorption Spectroscopy (TDLAS) and photoluminescence
- ultra-low duty cycle signals: best analyzed with boxcar averagers
- application examples: low-repetition rate Pump-probe, Raman, and Terahertz spectroscopy
Many times, however, one is confronted with signals whose profile does not fall exactly fall in one of these two categories, but somewhere in between. In fact, for more complex signals, it’s not a priori clear which measurement approach would lead to the best SNR. While the duty cycle is an important factor, other aspects such as the actual frequency of the signal, specific noise sources, synchronous interference at the signal frequency, and measured harmonics provided by the instrument also play significant roles. The interaction among these factors can be quite complex, making it difficult to predict the best approach.
In this case, it is recommended to try both lock-in amplification and boxcar averaging and only then evaluate which approach yields the best SNR, as shown in Figure 5.
A point worth mentioning is also that lock-in measurements are normally rather easy to set up and less demanding in terms of bandwidth and sampling rate. Boxcar averaging requires faster electronics and the optimization of several parameters, but this added complexity allows for low duty-cycle pulsed signals which enables us to push the limits in terms of SNR and measurement speed.
Owing to its digital nature and its state-of-the-art analog performance, the UHFLI 600 MHz Lock-in Amplifier offers both functionalities in a single device. This allows you to compare the performance of lock-in amplification and boxcar averaging consistently using the same instrument, making the comparison straightforward and enabling you to make an informed choice for your experiment.
Additionally, the instrument offers other additional analysis tools such as the Scope, Sweeper, demodulation at multiple frequencies, and Data Acquistion Module (DAQ), whose operation can be fully parallelized.

For a step-by-step guide on how to perform the SNR comparison between lock-in amplification and boxcar averaging on our LabOne software, you can read this blog post.
Furthermore, for a thorough explanation and the rigorous mathematical background of the two measurement approaches, you can dive deeper with the respective white papers: Principle of Lock-in Detection and Principle of Boxcar averaging.
Conclusion
Lock-in amplifiers and boxcar averagers are complementary tools for analyzing periodic signals in optics and photonics experiments. The former is versatile and effective for recovering tiny signals at a single frequency, while the latter excels in low-duty cycle scenarios where the information content extends to multiple frequency components. For complex signals, a direct comparison of the SNR obtained with both techniques is the only way to determine the most successful measurement approach. With instruments like the UHFLI lock-in amplifier offering both functionalities, researchers can efficiently determine the optimal measurement technique for their experiments, leading to reduced measurement complexity and shorter time to publication.